Is Your Process World-Class or Broken? Understanding DPMO and Sigma Levels
Introduction
Every organization, whether it’s a manufacturing plant, a retail business, or a service provider, has one thing in common: processes. The quality of these processes directly determines customer satisfaction, cost efficiency, and overall competitiveness. But here’s the big question:
👉 How do you measure whether a process is truly world-class, average, or fundamentally broken?
The answer lies in DPMO (Defects Per Million Opportunities) and the Sigma Level.
In this article, we’ll explore these concepts in depth, backed with real-world examples from manufacturing, retail, and services, and show you how to calculate them using Excel. By the end, you’ll be able to evaluate your own process and benchmark it against world-class standards.
What is DPMO?
DPMO (Defects Per Million Opportunities) is a universal metric used in Six Sigma to measure the number of defects in a process per one million opportunities for a defect to occur.
The formula is:

This allows businesses to normalize their defect rate regardless of process size, making it comparable across industries.
Example:
- If a factory produces 100,000 mobile phones, and each phone has 20 features checked, that’s 2,000,000 opportunities for defects.
- If 500 defects are found, then:

That means the factory has 250 defects per million opportunities — a very high-quality level.
What is Sigma Level?
While DPMO gives a number, the Sigma Level translates it into an easily understandable scale of quality.
Sigma in simple terms:
- 1 Sigma: Very poor quality (690,000+ defects per million).
- 3 Sigma: Industry average (66,807 defects per million).
- 6 Sigma: World-class (only 3.4 defects per million).
Sigma Calculation:
In practice, Sigma Level is calculated using statistical models and often includes a 1.5 Sigma shift to account for process variation.
A commonly used Excel formula is:

This converts the defect rate into a Sigma benchmark.
Why Do DPMO and Sigma Matter?
- Benchmarking: Know if your process is competitive.
- Cost Savings: Fewer defects → less rework and wastage.
- Customer Satisfaction: Higher Sigma → more reliable product/service.
- Continuous Improvement: Identify where improvements are needed.
- Cross-Industry Comparisons: Compare a retail process with a factory process on the same scale.
Real-World Examples
Let’s explore three industries with practical scenarios.
🏭 Example 1: Manufacturing – Automobile Assembly
Scenario:
A car plant produces 1,000 cars per month. Each car has 50 quality checkpoints. In a month, 500 defects were recorded.
Calculation:
- Units = 1,000
- Opportunities per unit = 50
- Defects = 500
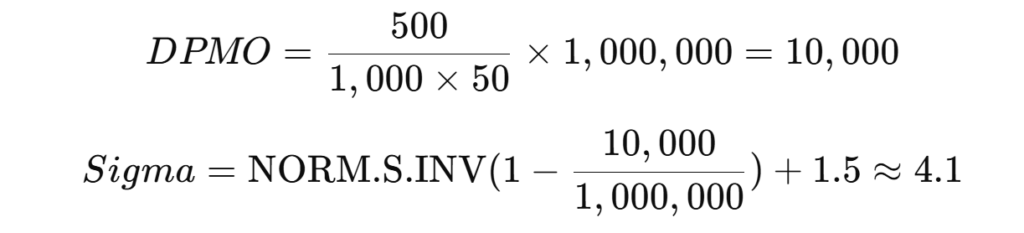
Takeaway:
The process is decent (4 Sigma) but not world-class. Aiming for 5–6 Sigma could drastically reduce recalls and warranty costs.
🛒 Example 2: Retail – Order Fulfillment Accuracy
Scenario:
A retail chain processes 2,000 customer orders per month. Each order has 10 possible error points (wrong product, delay, missing item, etc.). Out of these, 196 mistakes occurred.
Calculation:
- Units = 2,000
- Opportunities = 10
- Defects = 196
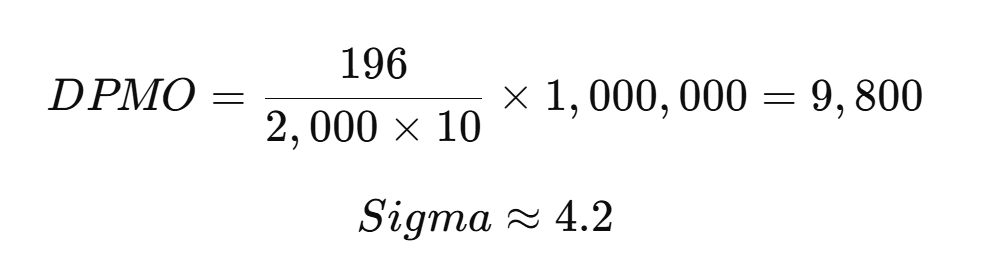
Takeaway:
The retail process is slightly better than manufacturing in this case. Still, order accuracy must improve to boost customer loyalty and reduce refunds.
📞 Example 3: Services – Call Center
Scenario:
A call center handles 5,000 tickets per month. Each ticket has 5 opportunities for error (wrong info, delay, unresolved, etc.). 400 issues were recorded.
Calculation:
- Units = 5,000
- Opportunities = 5
- Defects = 400
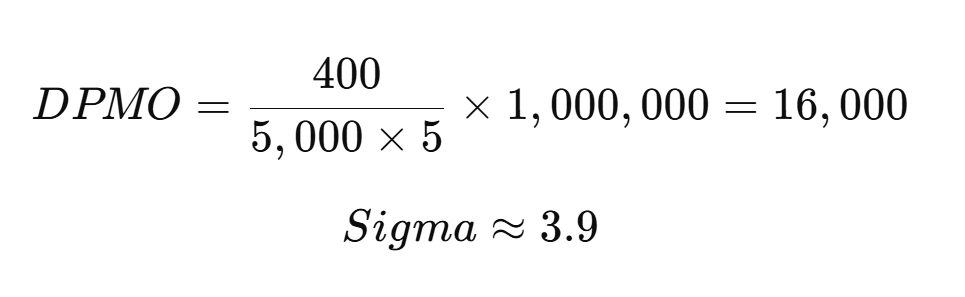
Takeaway:
Service industries usually face higher variability. At below 4 Sigma, this process needs improvement in training, systems, and SOPs.
How to Calculate DPMO in Excel
Step 1: Enter data into cells:
- Units Produced (A2)
- Opportunities per Unit (B2)
- Defects Found (C2)
Step 2: Formula for DPMO:
=(C2/(A2*B2))*1000000Step 3: Formula for Sigma:
=NORM.S.INV(1-(D2/1000000))+1.5(where D2 = calculated DPMO)
This makes it easy for any business to run the calculation instantly.
Applications Across Industries
- Manufacturing: Fewer product defects = lower warranty costs.
- Retail: Better order accuracy = higher customer loyalty.
- Services: Fewer errors = faster resolutions and happier customers.
- Healthcare: Fewer medical errors = safer patients.
- Banking: Fewer transaction errors = stronger trust.
Common Misconceptions
- “Six Sigma is only for manufacturing.”
❌ Wrong. It applies to any process with measurable outcomes. - “Sigma means perfection.”
❌ Wrong. Even at Six Sigma, you can still have 3.4 defects per million. - “It’s too complicated.”
❌ Wrong. With simple Excel formulas, anyone can calculate DPMO and Sigma.
FAQs
Q1: What’s a good Sigma level?
- 3 Sigma = Industry average
- 4–5 Sigma = Good, competitive
- 6 Sigma = World-class
Q2: Why use the 1.5 Sigma shift?
It accounts for natural process variation over time, making results realistic.
Q3: Can small businesses use Sigma?
Absolutely. Even small improvements can drastically reduce errors and costs.
Q4: Do I need special software?
No. Excel, Google Sheets, or any stats tool can calculate Sigma easily.
Conclusion
Processes drive success. Whether you’re making cars, fulfilling online orders, or handling customer calls, defects cost money, time, and reputation.
👉 By calculating DPMO and Sigma Level, you gain a clear, universal benchmark to measure process performance.
- If you’re at 3 Sigma, you’re average.
- If you’re at 4–5 Sigma, you’re doing well but have room to grow.
- If you’re at 6 Sigma, you’re truly world-class.
Start by measuring today — and take the first step toward continuous improvement and operational excellence.
Call to Action
If you found this article useful:
- 📺 Watch my full YouTube video where I demonstrate these calculations step by step in Excel.
- 💬 Comment your own Sigma level experiences.
- 🔔 Subscribe for more insights on quality, supply chain, and operations management.
Tag:business excellence, business process improvement, continuous improvement, customer satisfaction, data driven decisions, Defect Reduction, defects per million opportunities, design for six sigma, DMADV, DMAIC, dpmo, kaizen, lean manufacturing, Lean Six Sigma, operational efficiency, operational excellence, performance improvement, problem solving, process analytics, process control, process excellence, Process Improvement, process optimization, process quality, productivity improvement, quality assurance, quality control, Quality Management, root cause analysis, sigma level, Six Sigma, six sigma methodology, six sigma tools, total quality management, waste reduction, world class manufacturing